Information on experimental applications of Fluorescence Correlation Spectroscopy (FCS) in biology and biochemistry.
The following sections describe the advantages that make Fluorescence Correlation Spectroscopy (FCS) an ideal technique for measuring and assaying molecular interactions.
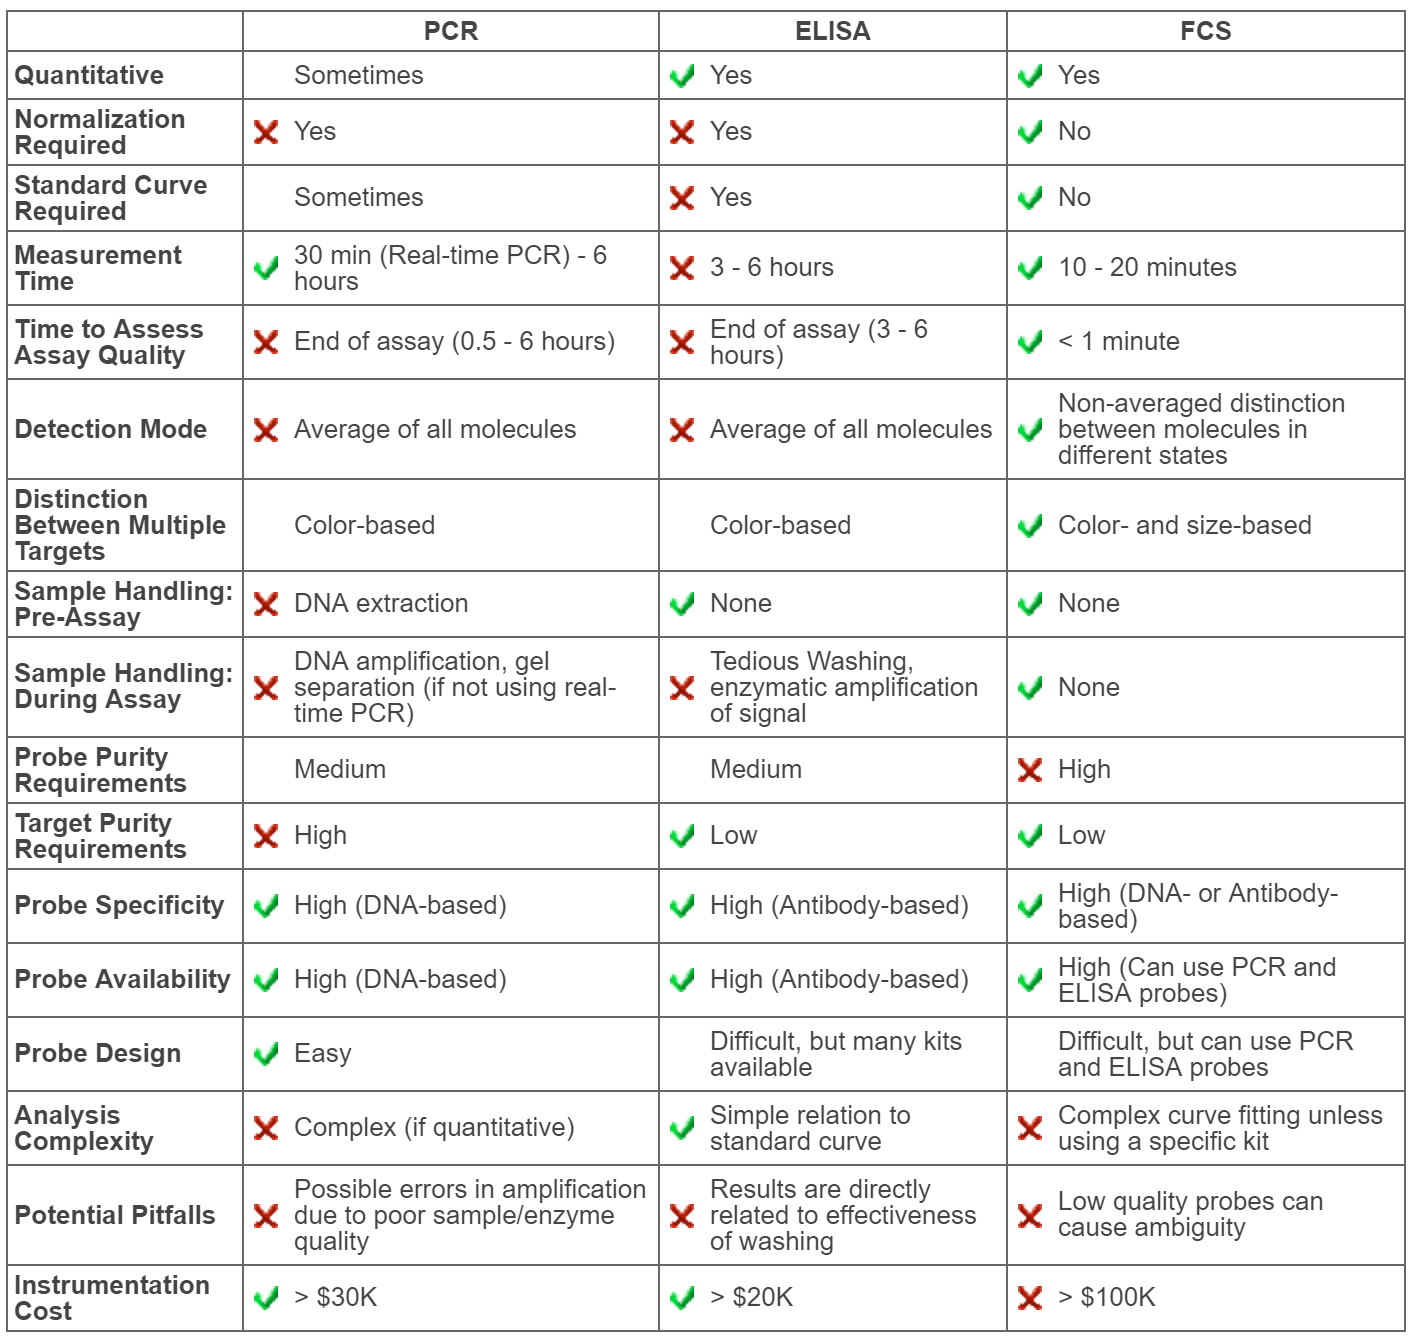
For a comparison of the advantages and disadvantages of FCS, ELISA, and PCR, see FCS vs. Conventional Bioassays (ELISA & PCR)
The interaction and complexing of biomolecules is fundamental to biological functions. Important examples of molecular interactions include:
These interactions and binding events are extremely specific to the particular molecules involved and, as a result, the high specificity and selectivity of these interactions can be used to form the basis of biochemical assays. Biochemical assays utilize specific biomarker probes to identify and measure the presence of specific target molecules (e.g., an enzyme probe against the target glucose molecule will bind only glucose, not other sugars).
All of the following industries involve research of molecular interactions:
Even in its simplest form, autocorrelation mode, Fluorescence Correlation Spectroscopy (FCS) provides a highly flexible, easy-to-use assay format. These properties of FCS measurements make it an incredibly convenient assay
method:
Most techniques for measuring molecular interaction are intensity-based, which means that they measure the average intensity of a sample, and therefore the average amount of an assay probe without distinguishing bound from
unbound material. In contrast, FCS is a nonaveraging technique, offering simultaneous measurement and distinction of bound and unbound fractions. As a result, FCS:
When operated in cross-correlation mode, FCS offers the possibility of assaying interactions of multiple targets simultaneously. These properties of cross-correlation assays introduce significant advantages to FCS-based assays:
The advantages of Fluorescence Correlation Spectroscopy (FCS) explained in Advantages of FCS for Assaying Molecular Interactions showed that FCS compares favorably with conventional bioassays and elaborated conditions where it exceeds the performance of conventional assays.
Table 1 below lists some relative advantages and disadvantages of conventional polynucleic acid based assays (typified by PCR), immuno-based assays (typified by ELISA), and FCS.
No assay is the perfect choice for all circumstances, however, these tables clearly illustrate that FCS offers unique capabilities not available from competing detection/measurement techniques.
Want to learn more about FCS? See What is FCS?
Table 1: Advantages & Disadvantages of PCR, ELISA, & FCS
Fluorescence Recovery After Photobleaching (FRAP), Fluorescence (or Förster) Resonance Energy Transfer (FRET), and Fluorescence Correlation Spectroscopy (FCS) are three fluorescence-based techniques that are commonly used to study molecular diffusion and/or complexing. Below, we describe these techniques and compare the properties obtained from each.
More Information Below:
FRAP is performed in a variety of ways. In Spot FRAP, for example, a small volume is rapidly bleached and the recovery of fluorescence intensity in this spot is measured as bleached fluorophores diffuse out of the volume and unbleached fluorophores diffuse in.
FRET measures molecular proximity by measuring the dipole induced dipole interaction between donor and acceptor fluorophores. Methods of determining the degree of FRET include: donor quenching, appearance of sensitized acceptor emission, decrease in donor lifetime, depolarization of donor fluorescence, and reduction in donor photobleaching.
FCS measures the fluctuations of fluorescence as molecules and/or complexes diffuse in and out of a small confocal volume.
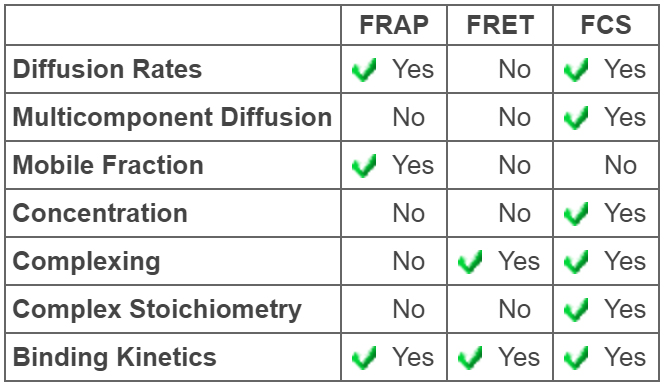
In Table 2 to the right we compare the information that can be obtained from these three techniques about molecular diffusion and complexing. We focus on these physical properties:
The ability of the technique to measure diffusion rates, typically expressed as the diffusion coefficient of the molecule or molecular complex
The ability of the technique to detect and distinguish between single and multiple component diffusion
The possibility that only a fraction of the species are free to diffuse, the rest being immobile
The ability of the technique to provide an independent calibration-free measure of molecular concentration
The ability of the technique to detect molecular complexing
The ability of the technique to determine the stoichiometry of molecular complexes, i.e. the fundamental ratio at which molecules combine
The ability of the technique to measure on and off kinetics of complex formation
Table 2: A Comparison of Parameters Obtainable with FRAP, FRET, and FCS
FRAP is a relatively easy technique to implement. Determination of diffusion coefficients derives from diffusion times and therefore requires careful determination of the beam radius in both the xy plane and along the z axis. It has proven to be very difficult to extract multiple diffusion coefficients from FRAP.
FRAP is unique among the three techniques in its ability to detect mobile fraction. It does not provide an independent measure of concentration. Its ability to detect molecular complexing and to measure stoichiometry of these complexes is limited by its ability to distinguish diffusion coefficients. This is particularly problematic for two-dimensional diffusion, such as in membranes, where the dependence of diffusion coefficient on molecular size is logarithmic. FRAP can be used to measure molecular kinetics.
Because of the high level of bleaching light, it is extremely important to perform controls for photodamage. This applies both on the physical level (is the light damaging structure or inducing complexing?) and on the biological level (is the light damaging cells or biochemical pathways?).
FRET may be viewed as a method for proximity sensing. It is not generally implemented as a technique for measuring molecular diffusion. It does not provide an independent measure of donor concentration. With careful calibration it can provide a measure of acceptor concentration.
It is hard to obtain any information about stoichiometry, and this limited information can only be obtained with careful calibration. FRET is extremely powerful as a technique for measuring changes in the degree of complexing and as a result can be used to measure on and off kinetics of complex formation.
Debatably, FRET is more often abused than used properly. FRET refers to Förster Resonance Energy Transfer, the dipole induced dipole interaction between two singlet fluorophores states. This phenomenon requires that the efficiency of transfer between isolated donor acceptor pairs falls off as the reciprocal of the sixth power of the intermolecular distance. This must be demonstrated, or at the very least, one must use fluorophore pairs previously shown to exhibit this dependence. Without this assurance results can be misleading, or at the very least, are purely qualitative.
FCS can be used to measure both single and multiple component diffusion. As is the case for FRAP, determination of diffusion coefficients requires knowledge of the beam radii. FCS does not measure mobile fraction. It does provide a direct and independent measure of concentration without calibration. Because of this concentration measure and the ability to distinguish between diffusion coefficients, FCS data provide a measure of complex stoichiometry and binding isotherms. FCS can also be used to measure the on and off rates of complex formation.
FCS measurements depend upon having a significant amount of concentration fluctuations. This limits the concentration range over which FCS measurements can be made. This manifests itself as an upper limit to the concentration range. FCS measurement has historically been difficult to implement and has required a high level of expertise. Sensor Technologies’ QuantumXpertTM FCS Spectrometer is designed to change this by providing an easy-to-use intuitive FCS platform. See FCS Output Parameters for more information on information obtained by FCS.
Table I: A Comparison of Parameters Obtainable with FRAP, FRET, and FCS
Axelrod, D., Koppel, D. E., Schlessinger, J., Elson, E., and Webb, W. W., Mobility measurement by analysis of fluorescence photobleaching recovery kinetics., Biophysical Journal Vol 16., (1976) pp.1055-1069 (1976).
Braeckmans, K., Peeters, L., Sanders, N. N., De Smedt, S. C., and Demeester, J., Three-dimensional fluorescence recovery after photobleaching with the confocal scanning laser microscope., Biophysical Journal vol. 85, (2003), pp. 2240-2252 .
Haugland, R. P., Yguerabide, J., and Stryer, L. Dependence of the Kinetics of Singlet-Singlet Energy Transfer on Spectral Overlap Proceedings of the National Academy of Sciences of the United States of America, Vol. 63, No. 1 (1969), pp. 23-30
Magde, D., Elson, E. L., and Webb, W. W. Fluorescence Correlation Spectroscopy II. An Experimental Realization, Biopolymers, Vol. 13, (1974) pp. 29-61.
Fluorescence Correlation Spectroscopy (FCS) is an ideal technique for measuring and assaying molecular interactions such as antibody-antigen binding. FCS distinguishes components in your sample based on molecular weight, so it can easily differentiate bound antibody-antigen complexes from unbound antibody or antigen in solution.
Unlike ELISAs, which require immobilization and several wash steps, FCS allows you to measure antibody-antigen binding in solution, reducing assay length and allowing you to measure freely diffusing samples in a more physiologically-relevant state.
FCS measures the number of fluorescent particles in its detection volume, providing a direct measure of concentration without the need for standard curves. In addition to total concentration, FCS also gives you the relative concentration of bound and unbound antibody or antigen, so you will know exactly what concentration of your antibody or antigen is bound and what concentration is unbound.
By measuring the change in the concentration of the bound antibody-antigen complex over time, you can use FCS to obtain information on binding kinetics (kon, koff) and binding affinities (Kd, Ka).
By measuring the decrease in concentration of antibody-antigen complex upon inhibitor/competitor addition, you can determine inhibitor binding affinities (Ki, IC50).
By measuring the change in particle number and/or molecular size, FCS can tell you the antigen-to-antibody ratio of the bound complexes.
If you use two different fluorescent labels, FCS can measure two separate interactions in a single sample.
Fluorescence Correlation Spectroscopy (FCS) is an ideal technique for quantifying protein-protein interactions. FCS distinguishes components in your sample based on molecular weight, so it can easily differentiate bound protein-protein complexes from unbound proteins in solution.
FCS measures the number of fluorescent particles in its detection volume, providing a direct measure of concentration without the need for standard curves. In addition to total concentration, FCS also gives you the relative concentration of complexed and free protein, so you will know exactly what concentration of your protein is bound and what concentration is unbound.
By measuring the change in the concentration of the bound protein-protein complex over time, you can use FCS to obtain information on binding kinetics (kon, koff) and binding affinities (Kd, Ka).
By measuring the decrease in concentration of protein-protein complex upon inhibitor/competitor addition, you can determine inhibitor binding affinities (Ki, IC50).
By measuring the change in particle number and/or molecular size, FCS can tell you the stoichiometry of each protein bound in the protein-protein complexes.
If you use two different fluorescent labels, FCS can measure two separate interactions in a single sample.
Unlike surface plasmon resonance (SPR), which requires immobilization, FCS allows you to measure protein-protein interactions of freely diffusing proteins in a more physiologically-relevant state.