Correlation: A Fluorescence Example
Everyone has a sense about what the term correlation means. It means that the measurements of two properties are co-related. Let's explore this a little more closely.
Intensity Measurement
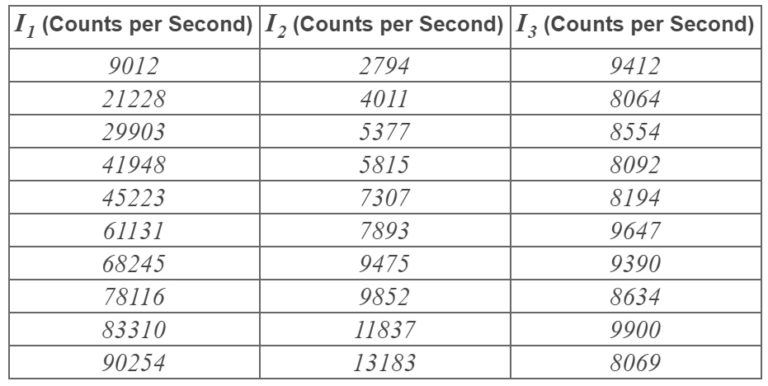
Suppose that we measure fluorescence signals at three wavelengths and call them I1, I2, and I3. Suppose that we get the following set of measurements of these three intensities.
Relationships Between Measurements
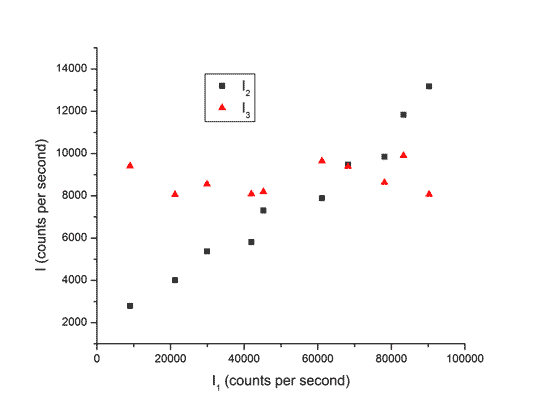
In Figure 1 we plot I2 and I3 versus I1. When we see this kind of data our intuition says that, yes, I2 and I1 are correlated because from a given value of I2 we can predict an approximate value of I1. I3 and I1 are not well correlated because the value of I3 is not a good predictor of the value of I1.
Degree of Correlation
Typically, to assess the degree of correlation between two measurements we would next perform a linear regression, as shown in Figure below, and calculate the regression coefficient.
High Correlation
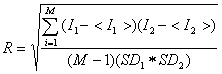
The black line in below Figure shows the linear fit between I2 and I1. The coefficient of correlation, R, of this fit is 0.98. Perfect correlation has an R value of 1.00 (See Correlation Mathematics, below, for the equation used to calculate R). So our intuition is confirmed the two intensities are indeed highly correlated.
Low Correlation
The red line shows the linear fit between I3 and I1. The low R value of 0.18 confirms that these two intensities are not highly correlated.
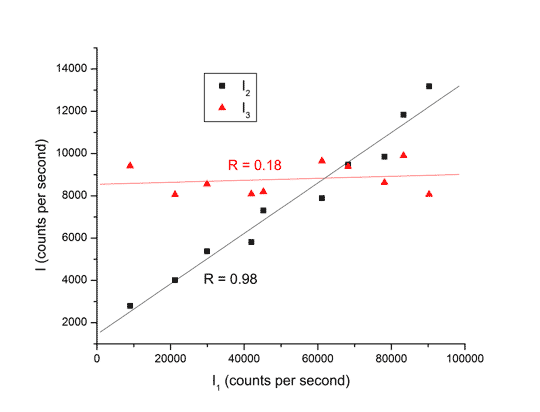
Above Figure: The Correlation Between Two Intensities. The lines indicate the linear least squares fit or regression lines.