Sample FCS Data

FCS data taken on the QuantumXpert for the following fluorophores.

Rhodamine 6G

Rhodamine 6G Concentration Titration
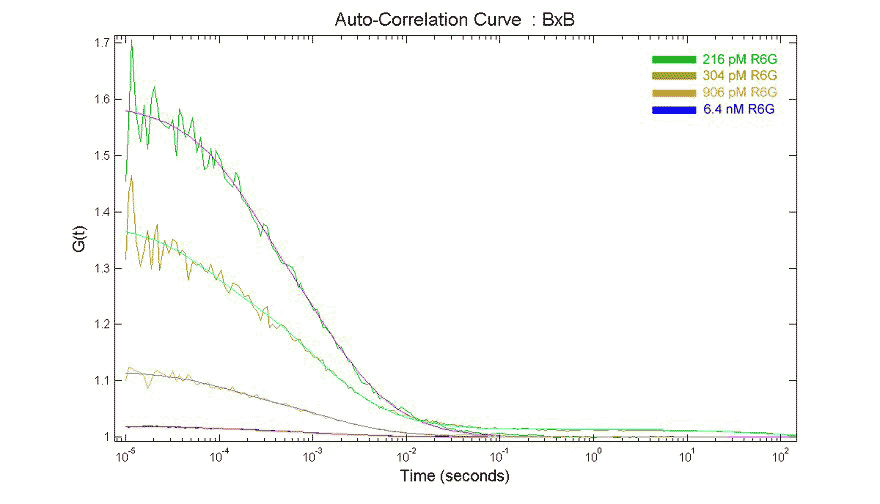
Autocorrelation Curves
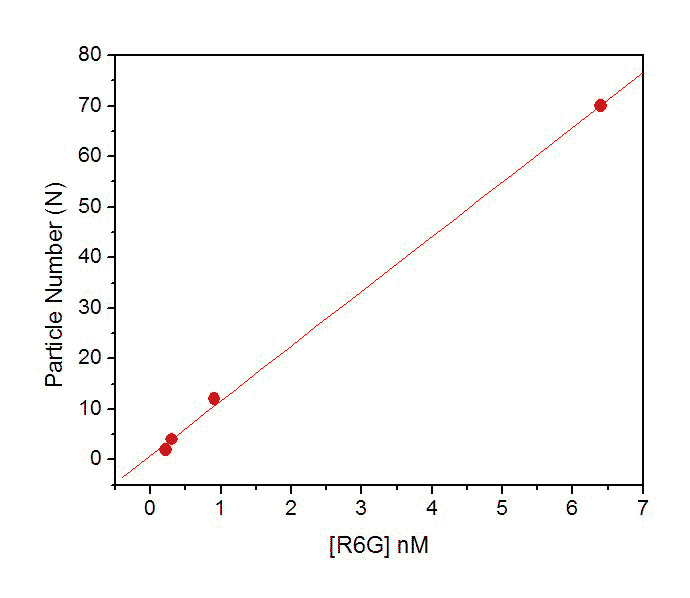
N as a Function of R6G Concentration
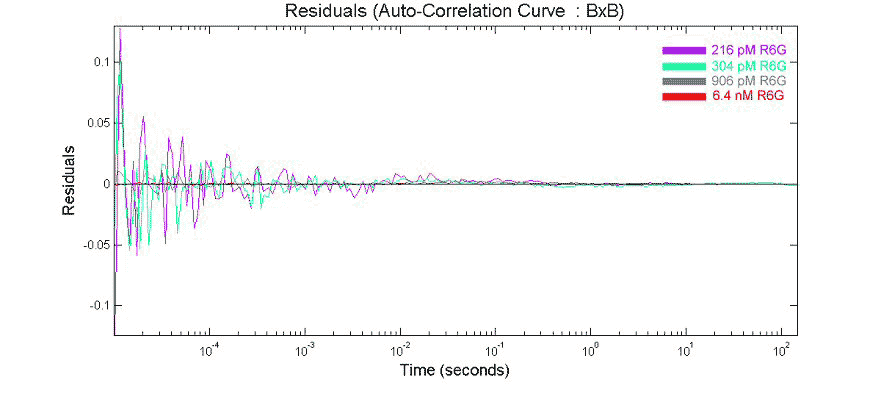
Residuals

Rhodamine 6G was measured at several concentrations to determine the linearity of particle number dependence on concentration.

A series of R6G concentrations were measured using the QuantumXpert FCS spectrometer. Autocorrelation curves show an increase in G(0) intercept as R6G concentration is decreased.

Table of Concentration, Particle Number (N), and Correlation Time (τD)

R6G (nM) N τD (msec)
6.4 70 1.18
0.906 12 1.12
0.304 4 1.01
0.216 2 1.19

Rhodamine 6G Viscosity Titration

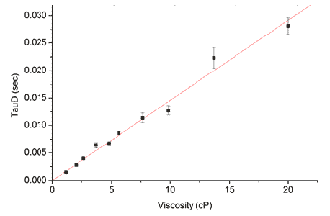
Plot of Correlation Time (τD) vs. Viscosity

Rhodamine 6G was measured at several viscosities to determine the linearity of correlation time dependence on viscosity.

Rhodamine 6G was measured on the QuantumXpert FCS spectrometer at several viscosities to determine the linearity of correlation time dependence on viscosity.

The plot of τD vs. viscosity, left, shows that the relationship between τD and viscosity is linear over the entire experimental range (1.15 - 20 cP).

Table of Viscosity and Correlation Time (τD)

Viscosity (cP) τD Std Error (N)
1.15 0.00155 0.00155
2.00 0.00276 1.73x10⁻⁴ (10)
2.65 0.00400 1.66x10⁻⁴ (10)
3.70 0.00642 4.97x10⁻⁴ (9)
4.80 0.00672 3.49x10⁻⁴ (8)
5.65 0.00863 3.29x10⁻⁴ (10)
7.65 0.0114 8.71x10⁻⁴ (10)
9.85 0.0127 8.74x10⁻⁴ (6)
13.7 0.0223 0.00192 (5)
20.0 0.0281 0.0015 (10)

For complete details of this experiment, please see the assay example, Using Viscosity to Simulate Changes in Molecular Size.